
Single-cell RNA-seq analysis
From raw output to a fully annotated dataset: quality control, doublet removal, integration, clustering and cell type annotation, followed by the downstream analysis your biology actually needs.
Confidential discussion under NDA · response within 48 hours
Why it matters
Single-cell is more than a UMAP
A UMAP is just the start of the analysis. By measuring expression gene by gene in every cell, single-cell lets you do far more: isolate a rare population, compare two conditions rigorously, reconstruct a differentiation trajectory, link a TCR/BCR immune repertoire to cell states. But that signal does not fall out of the data on its own: extracting it takes the right methods and real biological expertise. That is exactly what we do, from quality control through to the downstream analyses that answer your question. You leave with a usable result: a cell population to follow up, a figure for your paper, a clear answer for your programme. Not another folder of files.
Analytical pipeline
From raw reads to usable results
Each step addresses challenges specific to single-cell data: sparsity, ambient RNA, doublets, and batch effects between capture runs.
Quantification
FASTQ/BCL · Cell Ranger · split-pipe
QC & doublets
Empty drops · mito · scDblFinder
Integration & clustering
Harmony · scVI · Leiden
Annotation
Markers · reference · AI
Downstream
Pseudo-bulk DE · pseudotime · TCR
Report & figures
Written · publication-ready
What we can do
Single-cell analysis, in depth
Single-cell is our core specialty. Beyond a standard clustering and annotation workflow, we routinely take projects into the analyses that actually answer your biological question.
Cell type annotation
Manual marker-based, reference-based (SingleR, Azimuth, CellTypist) and AI-assisted annotation, cross-checked and validated by an expert.
Pseudo-bulk differential expression
Condition comparisons done right: counts aggregated per sample and cell type, modelled with DESeq2 or edgeR, controlling false positives.
Trajectory & pseudotime
Differentiation paths and pseudotime with Slingshot, Monocle3 and PAGA, plus RNA velocity (scVelo) for directionality.
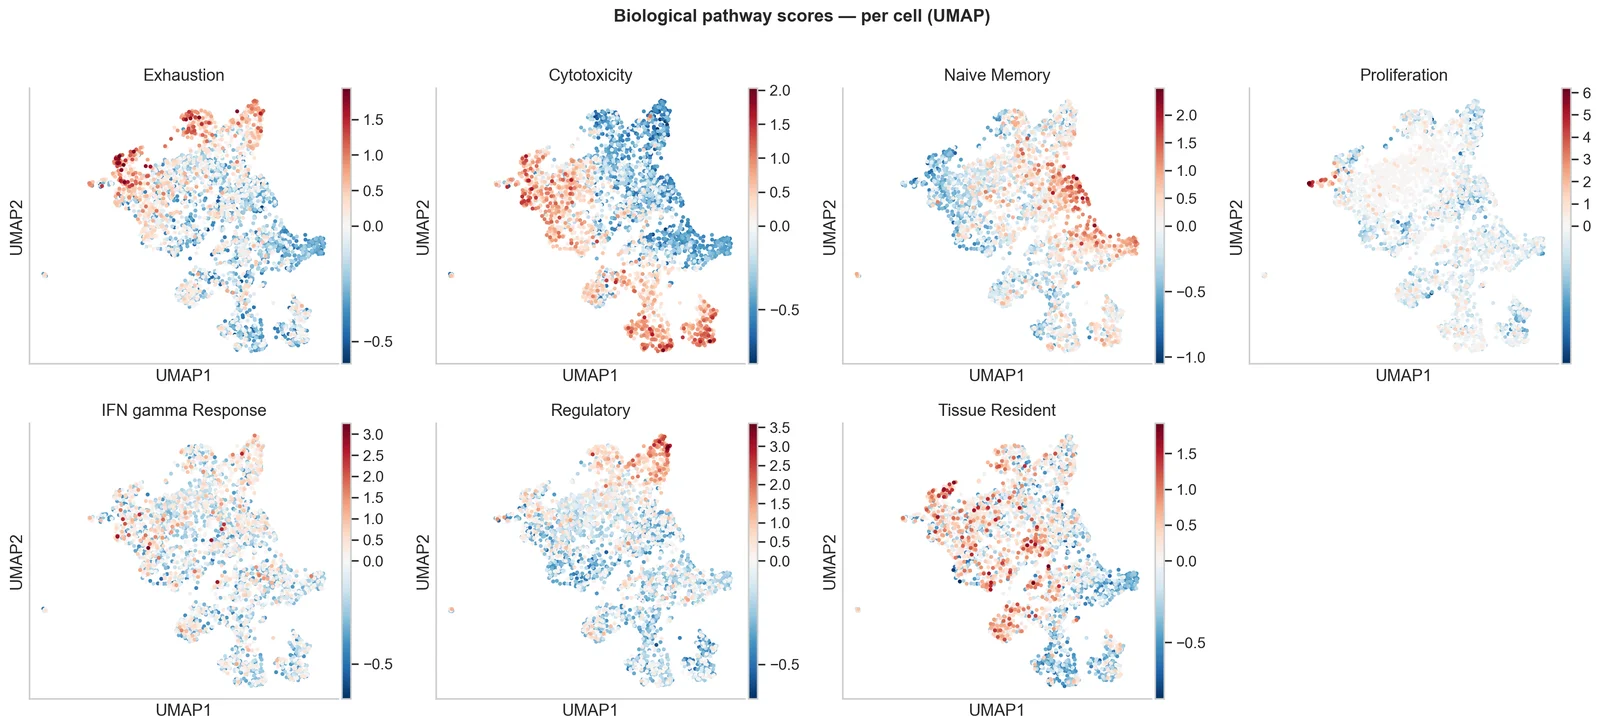
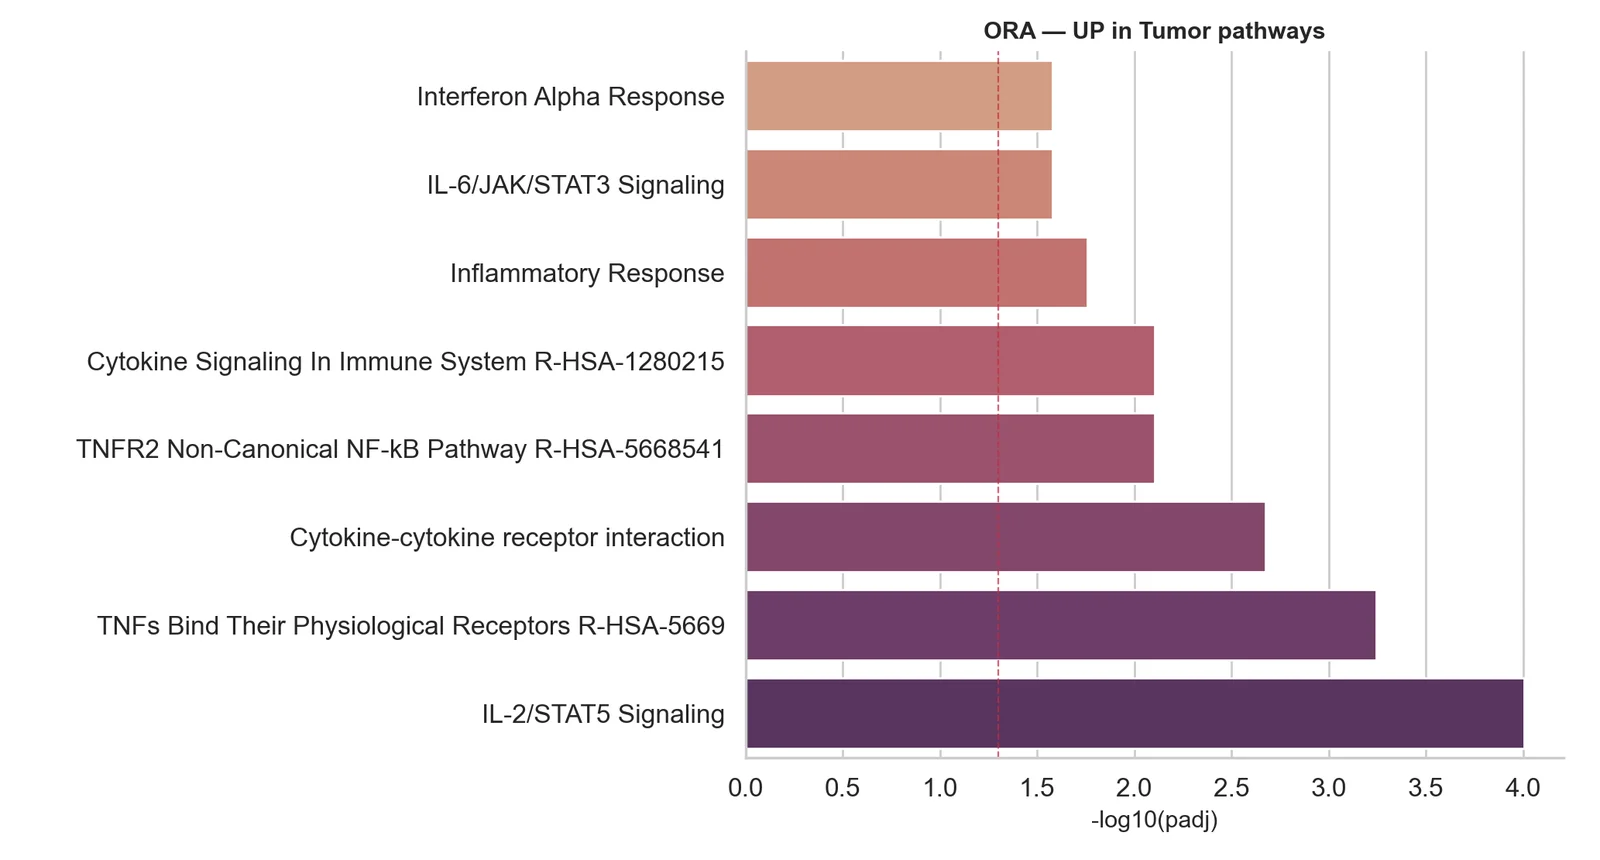
Pathway & signature inference
Gene-set and pathway activity per cell or cluster, turning marker lists into interpretable biological programmes.
TCR / BCR immune profiling
Paired single-cell gene expression and VDJ: clonotypes, clonal expansion and diversity, linked back to transcriptional cell states.
Multi-omics integration
CITE-seq surface proteins, single-cell ATAC (multiome), spatial transcriptomics and matched bulk RNA-seq combined into a coherent picture across layers.
The deliverable
Results structured, interpreted and ready to use
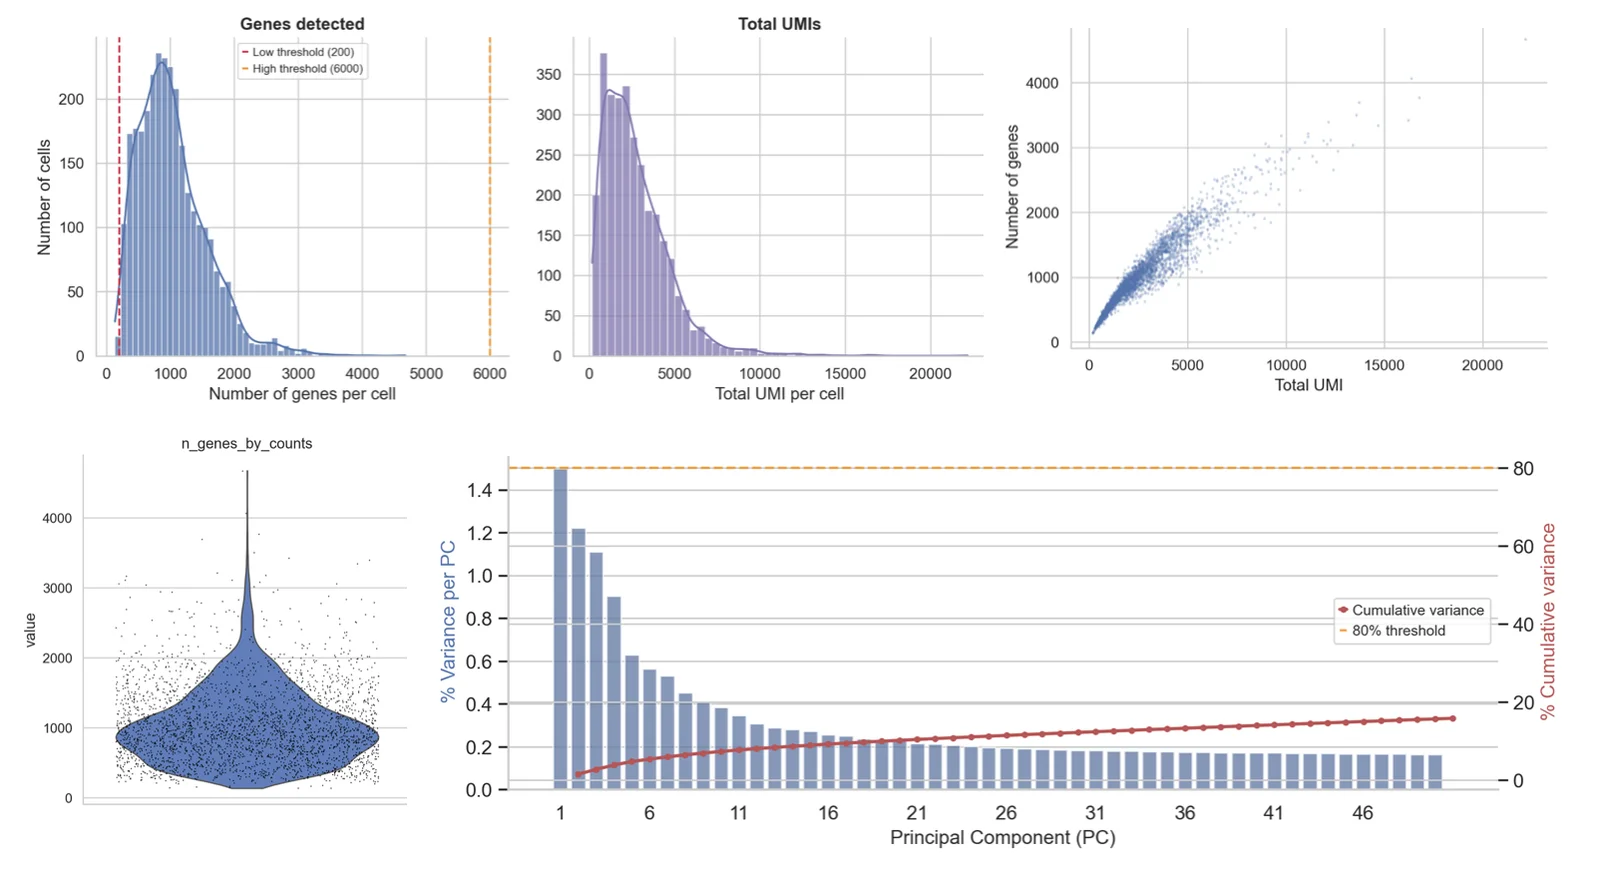
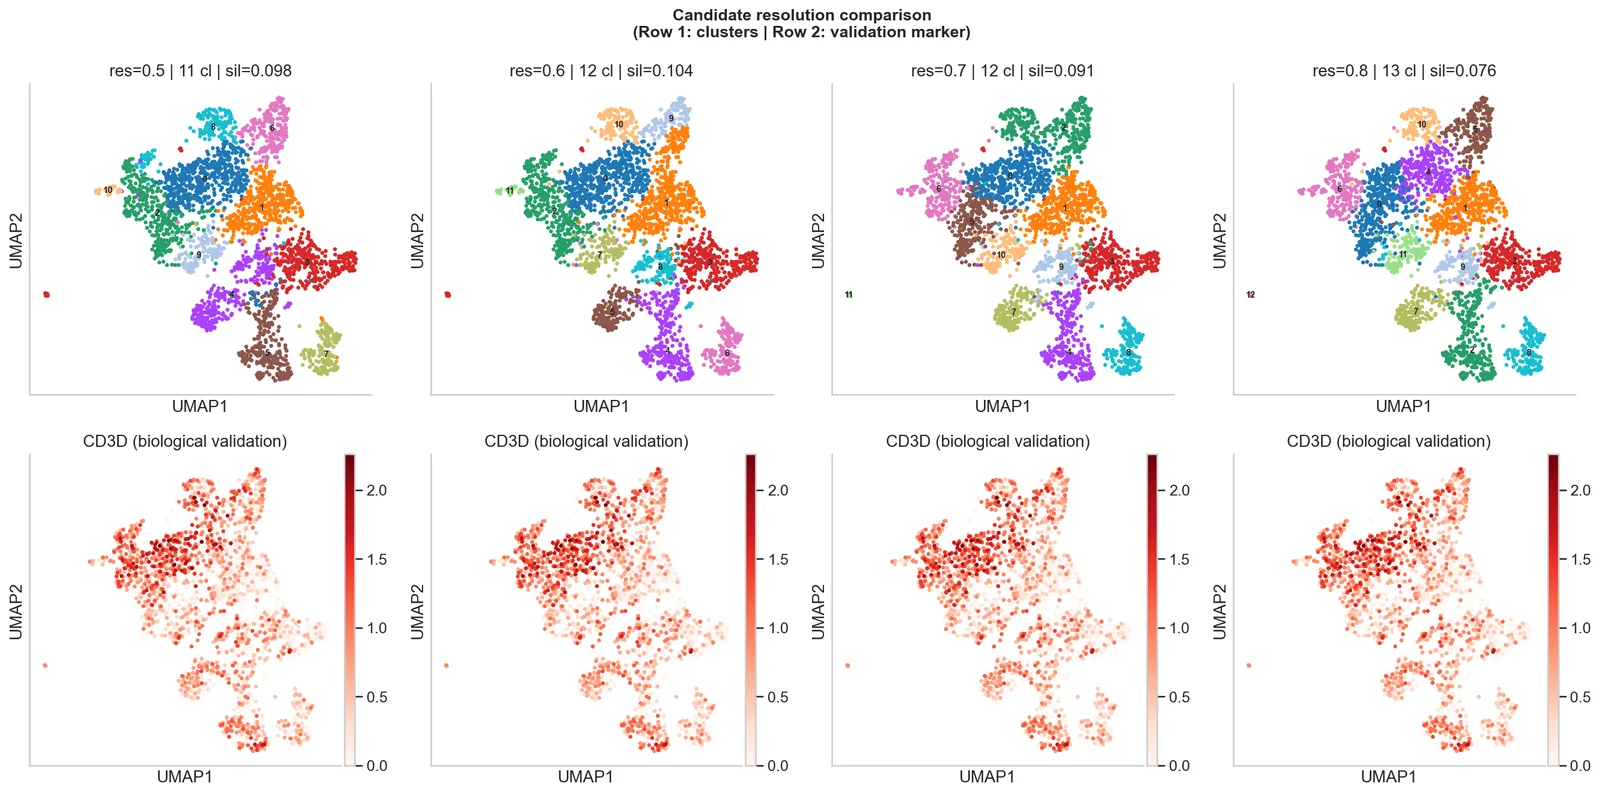
The examples below illustrate typical outputs from a single-cell project. The full scope of deliverables is always defined together at the start: which analyses, which figures and which formats best serve your scientific objectives and budget.
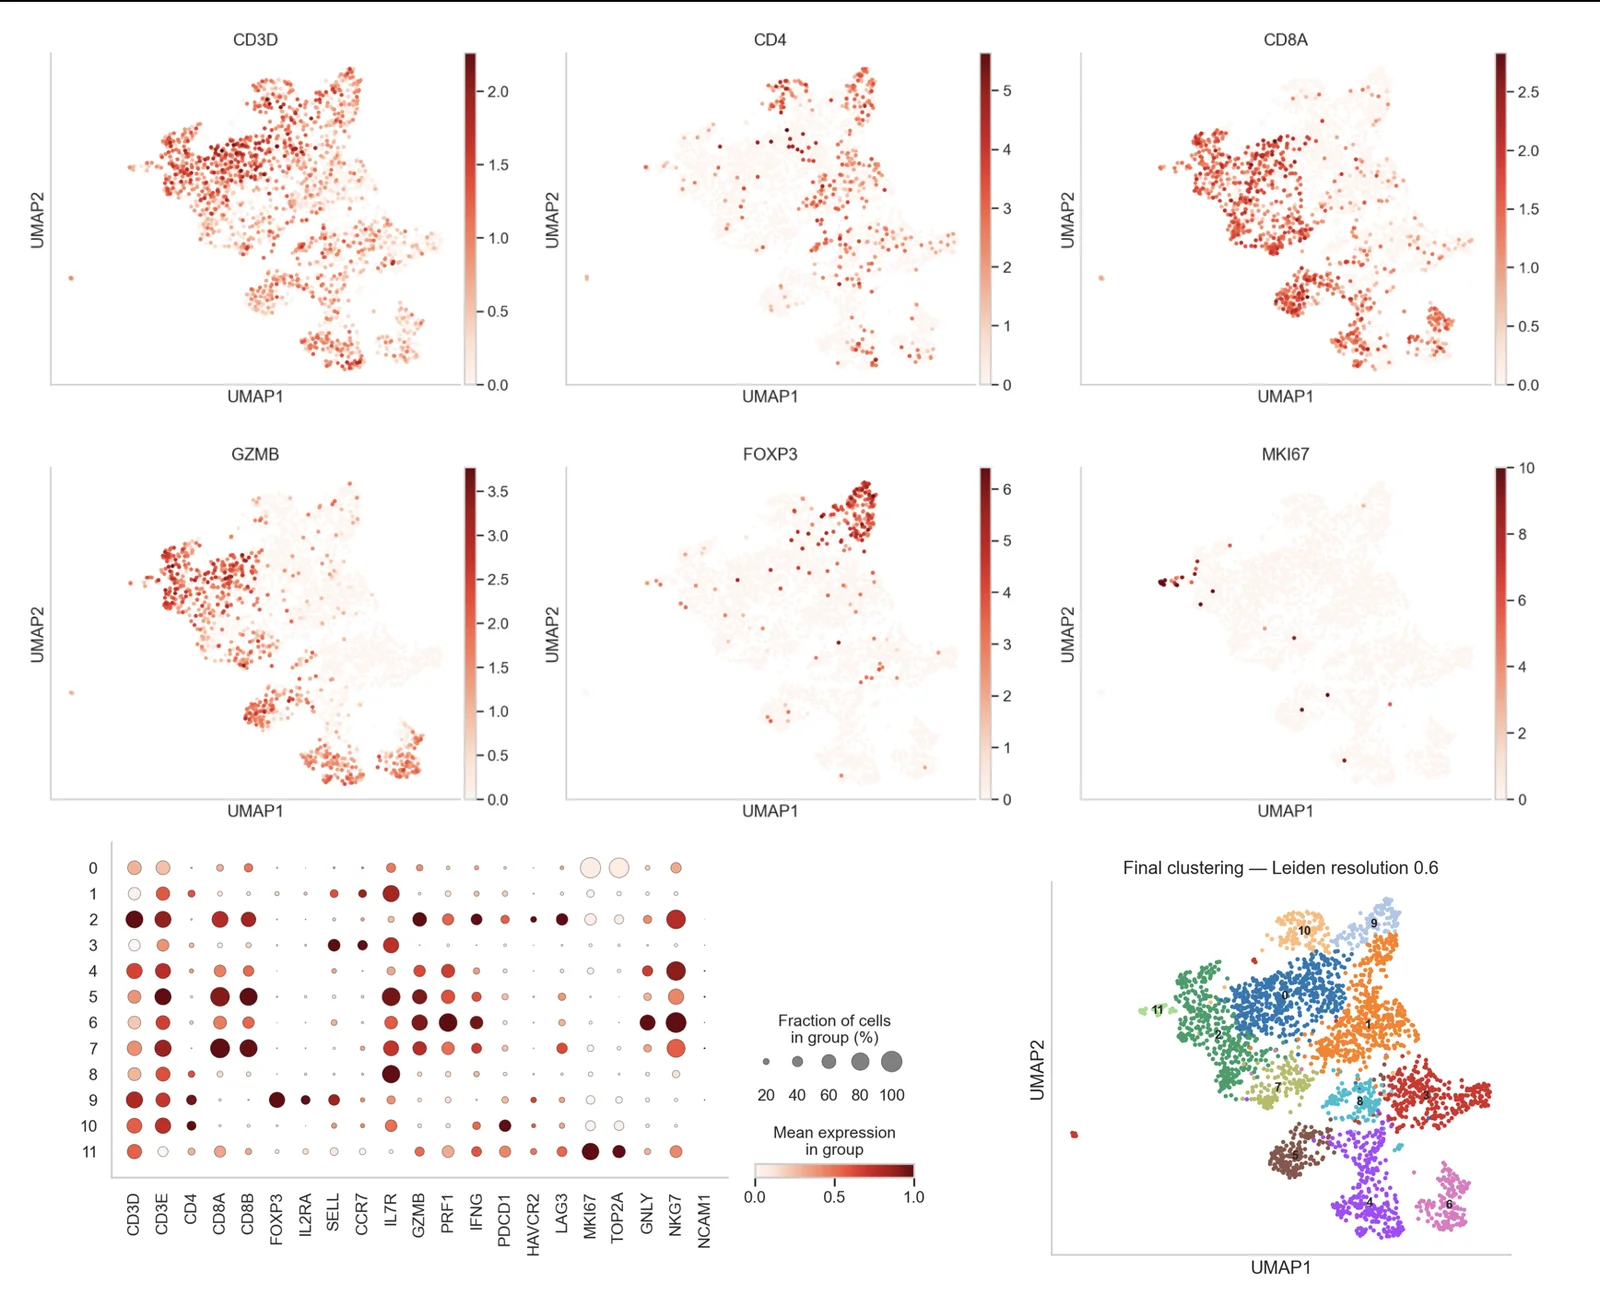
Written report
A full analysis report covering methods, results and biological interpretation, written for your audience.
Live debrief
A dedicated restitution session to walk through results, answer questions and align on next steps.
Traceable
Tool versions, parameters and reference atlases documented for every analysis step.
What's covered in the analysis
- QC & doubletsPer-cell metrics, filtering, doublet removal.
- IntegrationBatch correction with signal preserved.
- Clustering & UMAPLeiden clusters and embeddings.
- Cell type annotationLabels with marker evidence.
- Marker genesDotplots, heatmaps, per-cluster tables.
- Differential expression (option)Pseudo-bulk per cell type, DESeq2.
- Trajectory / repertoire (option)Pseudotime, RNA velocity, TCR/BCR.
- Methods & parametersTool versions, references, full reproducibility.
What you receive
- Analysis report: results, interpretation and conclusions.
- Publication-ready figures: high-resolution, journal-formatted.
- Marker & DE tables: official gene symbols, ready to submit.
- Annotated data object:
.h5ador.rdsfor your own reuse. - Restitution session: live walkthrough and Q&A.
How we work
Analytical rigour built for single-cell complexity
Per-cell QC thresholds
Mitochondrial fraction, gene count and UMI depth cut-offs are set from the actual distribution of your cells, not copy-pasted defaults.
Validated integration
Batch correction is verified against biological ground-truth markers: we confirm it removes technical noise without collapsing genuine cell-type differences.
Expert annotation
Automated and reference-based labels are reviewed against marker evidence by someone who knows the biology.
Versioned pipeline
A workflow with pinned tool versions means the same input always yields the same result.
Batch effects in single-cell are not always fixable after sequencing. If your study is still at the planning stage, our analysis of when computational correction is no longer enough is a good starting point, and our bioinformatics consulting covers experimental design before you generate data.
Getting started
Platforms and data we accept
Whatever your starting point (raw FASTQ files, a Cell Ranger matrix or a partially annotated object), the pipeline adapts to pick up where you are.
Droplet platforms
- 10x Genomics Chromium (3' and 5')
- 5' immune profiling with TCR/BCR VDJ
- BD Rhapsody and equivalents
Combinatorial barcoding
- Parse Biosciences Evercode (split-pipe)
- Plate-based Smart-seq2 / Smart-seq3
- Other custom chemistries
Any starting point
- FASTQ or BCL (raw sequencing output)
- Cell Ranger output, 10x
.h5 - AnnData
.h5ad/ Seurat.rds
Frequently asked questions
Which single-cell platforms do you support?
We routinely analyse data from 10x Genomics Chromium (3' and 5') and Parse Biosciences Evercode, as well as BD Rhapsody, Smart-seq2/3 and other droplet or combinatorial-barcoding chemistries. We can start from the manufacturer's raw output (Cell Ranger, split-pipe) or from a count matrix you have already generated.
Do you start from FASTQ files or a count matrix?
Either. We can process raw FASTQ or BCL files through quantification (Cell Ranger, STARsolo, salmon alevin-fry or kallisto bustools, and split-pipe for Parse data), or start from an existing count matrix or object (10x .h5, .h5ad / AnnData, Seurat .rds) if quantification has already been done.
How do you handle batch effects and integration across samples?
Batch effects are addressed first at the design level, then computationally with methods such as Harmony, scVI/scANVI or Seurat RPCA, chosen to fit your experimental structure. We always check that integration preserves genuine biological signal rather than erasing it, because some batch confounding cannot be corrected after the fact. We cover this in detail in our article on batch effects in scRNA-seq.
How do you annotate cell types?
We combine three approaches: manual annotation from canonical marker genes, reference-based annotation against curated atlases (SingleR, Azimuth, CellTypist), and AI-assisted annotation to accelerate and cross-check labels. Final labels are reviewed by an expert and justified by marker evidence, not accepted blindly from an automated call.
Can you do differential expression between conditions?
Yes. For comparisons between conditions or groups we use a pseudo-bulk approach (aggregating counts per sample and cell type, then modelling with DESeq2 or edgeR), which controls false positives far better than naive per-cell tests. We also provide per-cluster marker genes and, where relevant, compositional analysis of cell type proportions.
Do you offer trajectory, pseudotime and RNA velocity analysis?
Yes. We infer differentiation trajectories and pseudotime with tools such as Slingshot, Monocle3 and PAGA, and can add RNA velocity (scVelo) to indicate directionality. These analyses are applied when they answer a biological question, not as decoration.
Can you analyse TCR or BCR immune repertoire data?
Yes. We process paired single-cell gene expression and VDJ data (10x 5' immune profiling and equivalents), characterise TCR/BCR clonotypes, clonal expansion and diversity, and link repertoire features back to transcriptional cell states. This is a particular area of expertise.
Can you integrate single-cell data with other modalities?
Yes. We integrate scRNA-seq with CITE-seq surface proteins, single-cell ATAC (multiome), spatial transcriptomics and matched bulk RNA-seq, using multimodal methods such as totalVI, MultiVI and WNN to build a coherent picture across layers.
How is my data kept confidential?
We sign a non-disclosure agreement before any data transfer, exchange data through secure channels and never share or reuse your data. Where your institution has specific security requirements, we comply with them fully.
How much does a single-cell RNA-seq analysis cost?
The cost depends on the platform, the number of samples and cells, and the depth of downstream analysis requested (annotation only, or with differential expression, trajectories, repertoire and multi-omics integration). Every project is scoped and quoted transparently before any work begins. Send us your design and data type and we will reply with a clear scope, timeline and flat-rate quote within 48 hours.
Ready to turn your single-cell data into results?
Send us your platform, design and data type, and we'll reply with a clear scope, timeline and transparent flat-rate quote.
Confidential discussion under NDA. Response within 48 hours.
Request a quote