
Bulk RNA-Seq analysis
Quantification, differential expression and pathway enrichment. Your data analysed, interpreted and delivered as a complete interactive report, not a raw gene list. Biology you can act on, whether the next step is a publication or an R&D decision.
Confidential discussion under NDA · response within 48 hours
Why it matters
A spreadsheet of 20,000 genes is not a result
Most RNA-seq projects stall at the same point: a raw count matrix and a list of thousands of genes that no one has time to interpret. We take your sequencing data the rest of the way, with rigorous statistics, the right contrasts, and results placed in their biological context. The point is to reach conclusions: a figure for your paper, a target to prioritise, a clear go / no-go for your programme. Not more files.
Analytical pipeline
A transparent, end-to-end workflow
Every stage uses field-standard, peer-reviewed tools, with parameters justified by your data, never arbitrary defaults.
FASTQ
Raw reads or count matrix
QC & Trimming
fastp · Q30 · per-sample stats
Quantification
Salmon or STAR alignment
Differential expression
DESeq2 · robust modelling
Enrichment
GSEA / ORA · Hallmarks, GO, KEGG
HTML report
Interactive · self-contained
The deliverable
An interactive report, immediately actionable
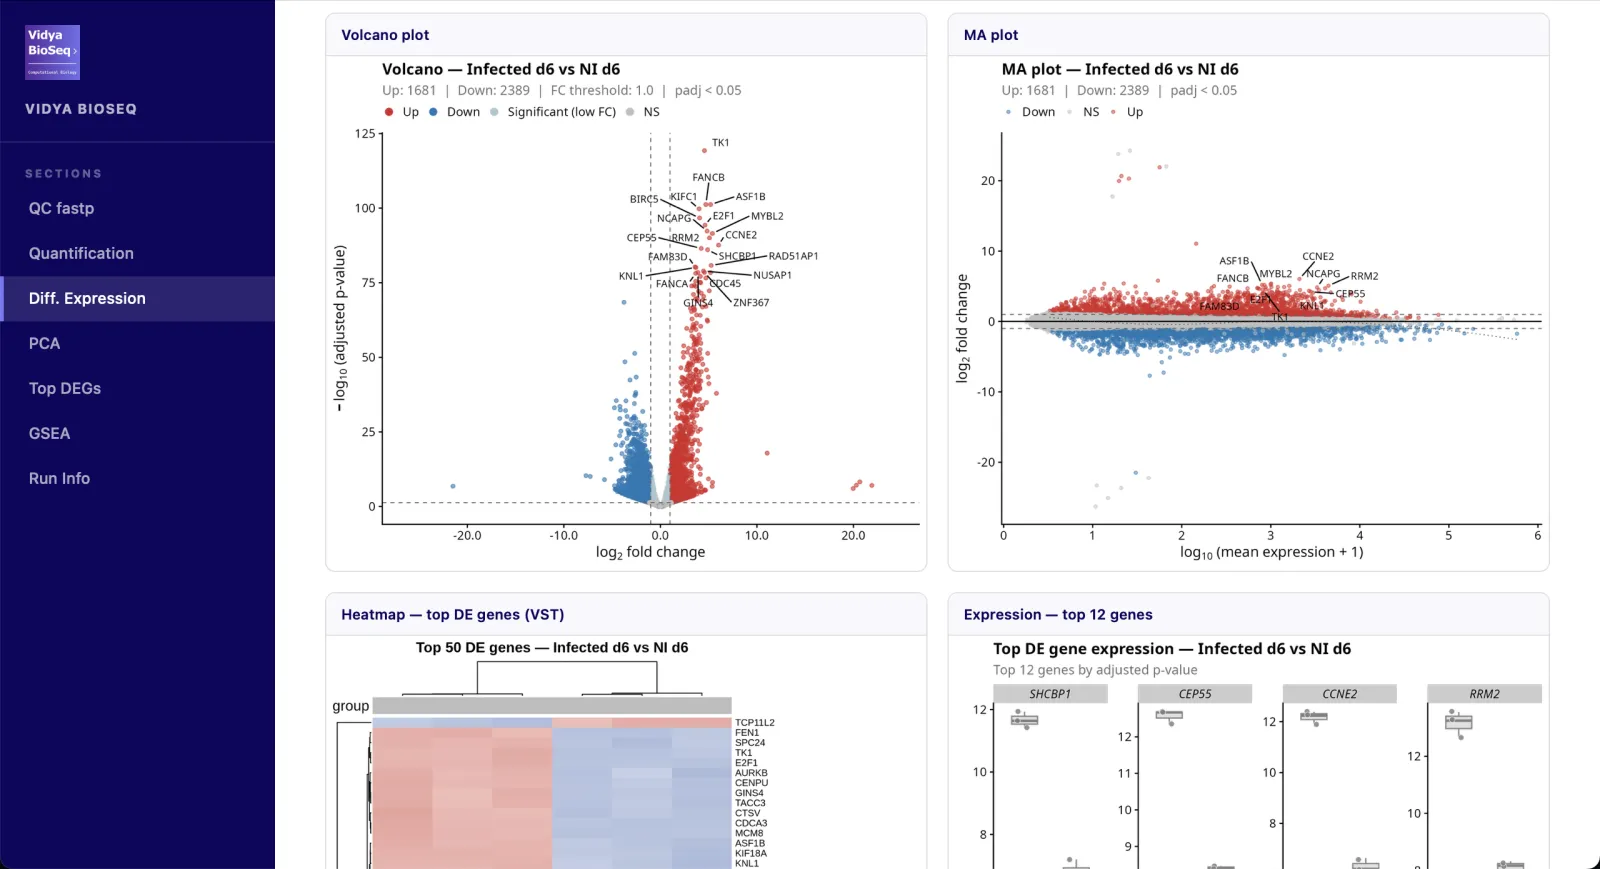
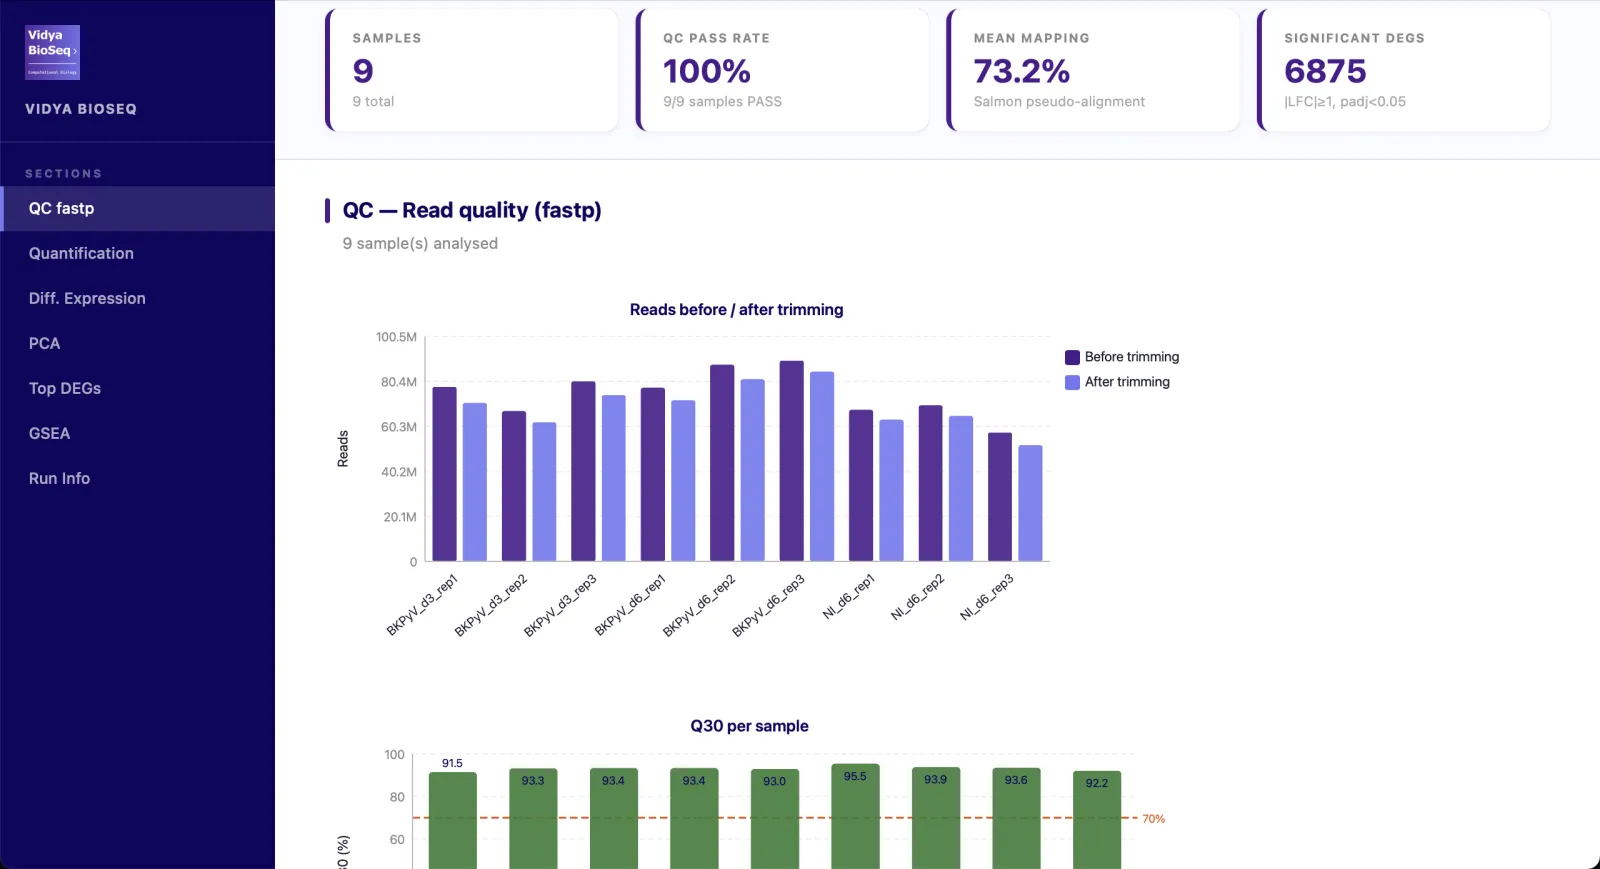
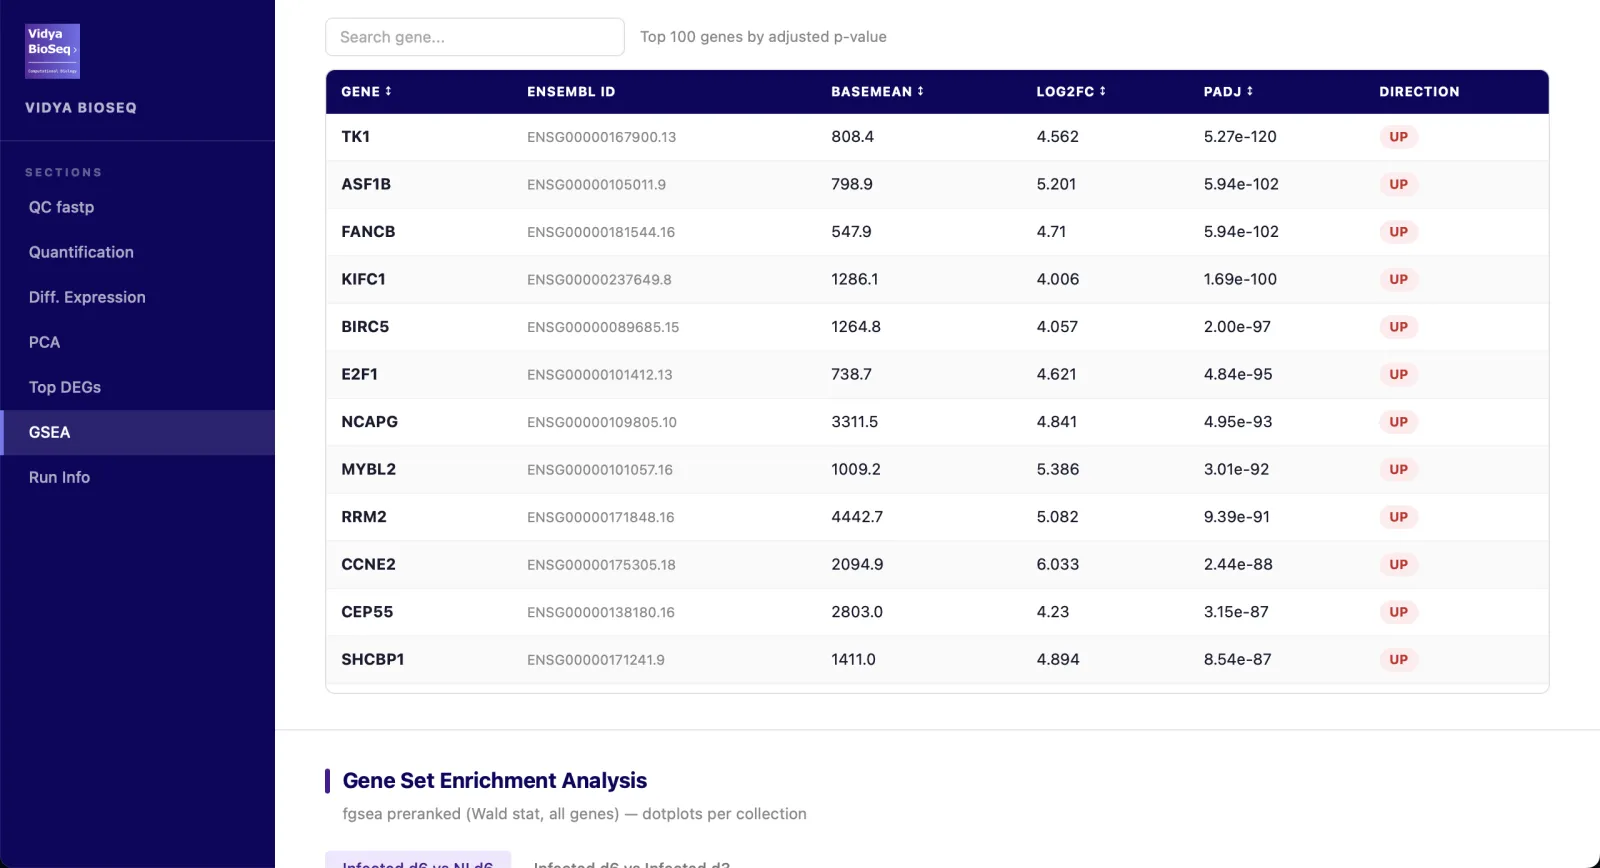
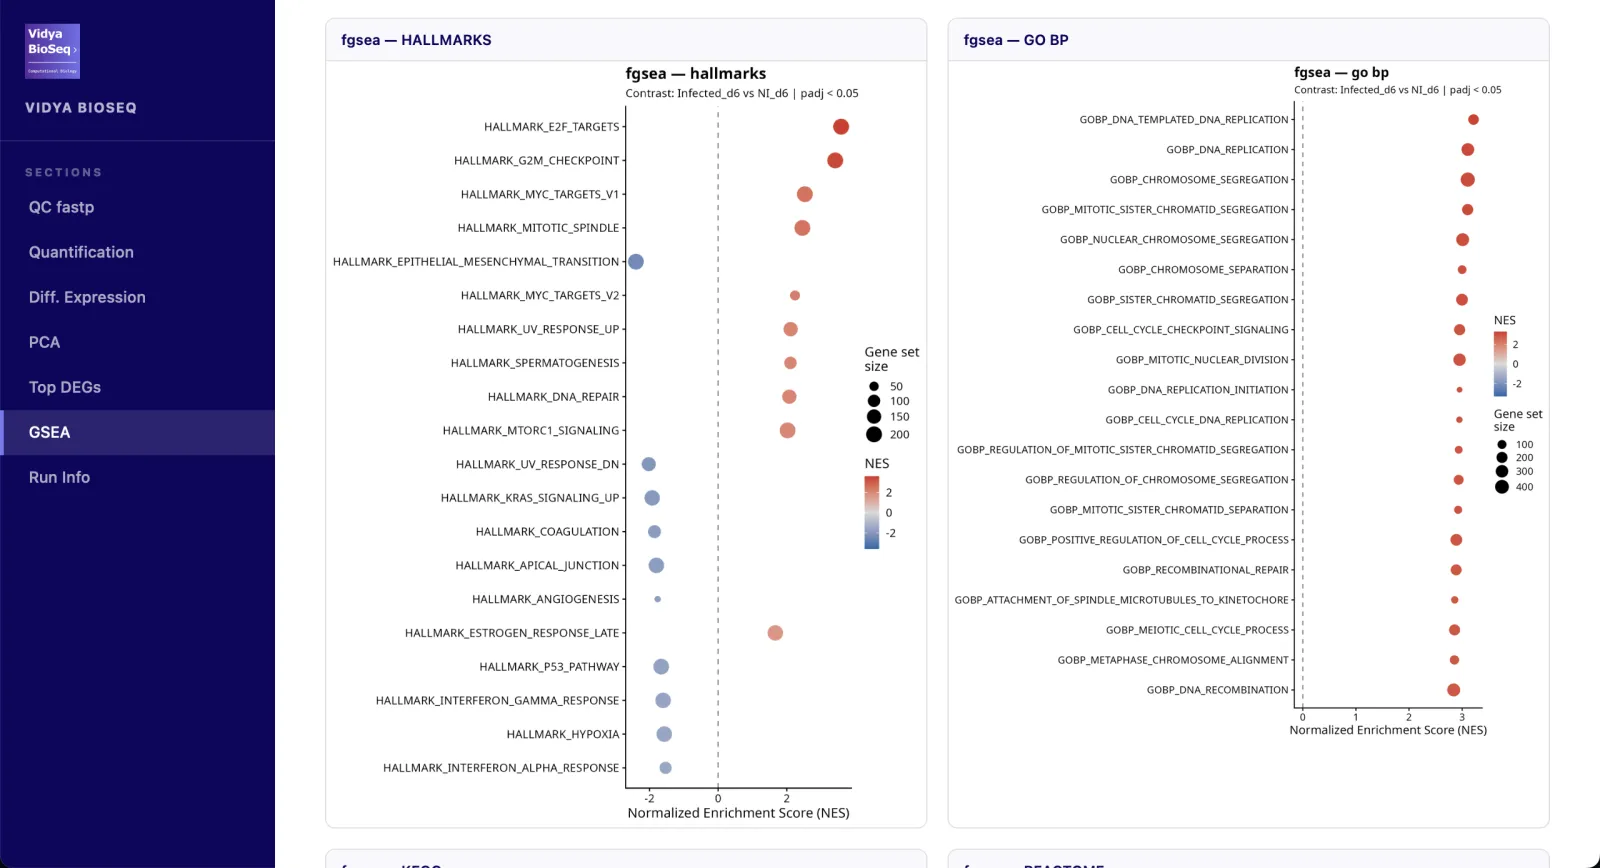
Every analysis ships with a self-contained HTML dashboard: no installation, no licence, and it works in any browser. Your key results are visible in seconds and ready to share with your team or steering committee.
Instant
Key results visible in seconds. No software to install, nothing to configure: just open the file.
Shareable
A single HTML file to forward to a collaborator, PI or steering committee, with everything embedded.
Traceable
Tool versions, parameters and genome references documented, with a SHA-256 manifest for every output.
What's inside the report
- QC & trimmingRead quality, Q30, fastp stats per sample.
- Quantification & alignmentMapping rate per sample, Salmon or STAR.
- Differential expressionVolcano · MA plot · heatmap · stripplots.
- PCA & clusteringGroup structure and outlier detection.
- Top DEGsInteractive table sorted by adjusted p-value.
- GSEA / ORA (option)Hallmarks, GO-BP, KEGG, Reactome.
- Run infoTool versions, references, parameters.
Delivery formats
- Self-contained HTML report: everything embedded, opens offline.
- High-resolution PDF figures: publication-ready.
- Annotated TSV tables: official gene symbols (HGNC).
- DESeq2
.rdsobject: for your own reuse. - SHA-256 manifest: integrity for every file.
How we work
Rigour you can defend to a reviewer or an R&D committee
Data-driven thresholds
Filtering and cut-offs are justified by the actual distribution of your data, not copy-pasted defaults.
Versioned pipeline
A Snakemake workflow with pinned tool versions means the same input always yields the same result.
Readable annotation
Gene identifiers mapped to official symbols, so your tables are usable by biologists, not just by machines.
Biological interpretation
Results are placed in functional context, turning a gene list into an interpretable signature.
Getting started
Data we accept
Whatever stage you are at, we can pick up your project, from the sequencer's raw output to a matrix you have already generated.
Raw sequencing reads
- FASTQ files, paired-end or single-end
- Gzipped (
.fastq.gz) - Any sequencing depth and read length
Pre-existing count matrix
counts.tsv/ CSV matrices- featureCounts or HTSeq output
- We start straight at the statistics
Any organism
- Human, mouse, rat as standard
- Non-model species supported
- Custom reference genome / annotation
Frequently asked questions
Do you start from FASTQ files or a count matrix?
Both. We can process raw FASTQ files (paired- or single-end, gzipped) through our full pipeline, or start from an existing count matrix (counts.tsv, featureCounts, HTSeq) if alignment has already been performed.
How many samples and replicates do I need?
At least three biological replicates per condition is recommended for robust differential expression. Fewer replicates are possible for exploratory work, and we are happy to advise on statistical power before you sequence.
Which organisms do you support?
Any species with a reference genome or transcriptome: human, mouse and rat as standard, as well as non-model organisms. Gene identifiers are mapped to official symbols (HGNC for human) for readable, publication-ready tables.
What is the typical turnaround time?
A standard design (for example two conditions with replicates) is typically delivered within 72 hours of receiving your data. More complex designs take longer, and we confirm a precise timeline before starting.
Can you handle complex experimental designs?
Yes. Multiple factors, batch effects, paired samples and time-course designs are modelled explicitly in DESeq2, so that the differential expression results reflect your real experimental structure rather than a simplified two-group comparison.
How is my data kept confidential?
We sign a non-disclosure agreement before any data transfer, exchange data through secure channels and never share or reuse your data. Where your institution has specific security requirements, we comply with them fully.
What if I need analyses beyond the standard report?
The standard report is a starting point. We routinely add custom figures, additional contrasts, gene-set signatures of interest or bespoke downstream analyses, and can integrate the results with other omics layers when needed.
How much does a bulk RNA-seq analysis cost?
The cost depends on three factors: the experimental design (number of conditions and contrasts), the number of samples, and the depth of analysis requested. A straightforward two-group comparison with a standard interactive report typically starts below €1,500. More complex designs, additional pathway databases or custom downstream analyses are scoped and quoted transparently before any work begins. Contact us with your design and we will send a flat-rate quote within 48 hours.
Ready to turn your RNA-seq data into results?
Send us your design and data type, and we'll reply with a clear scope, timeline and transparent flat-rate quote.
Confidential discussion under NDA. Response within 48 hours.
Request a quote